
2025 Admitted Class Profile
Applicants
-
1255Applied
-
42%Admitted
-
353Enrolled
Mean Age and Gender
-
32Age
-
15 %Male
-
83 %Female
-
2 %Gender not reported
GPA
-
3.5Mean Undergraduate GPA
-
3.8Mean Graduate GPA
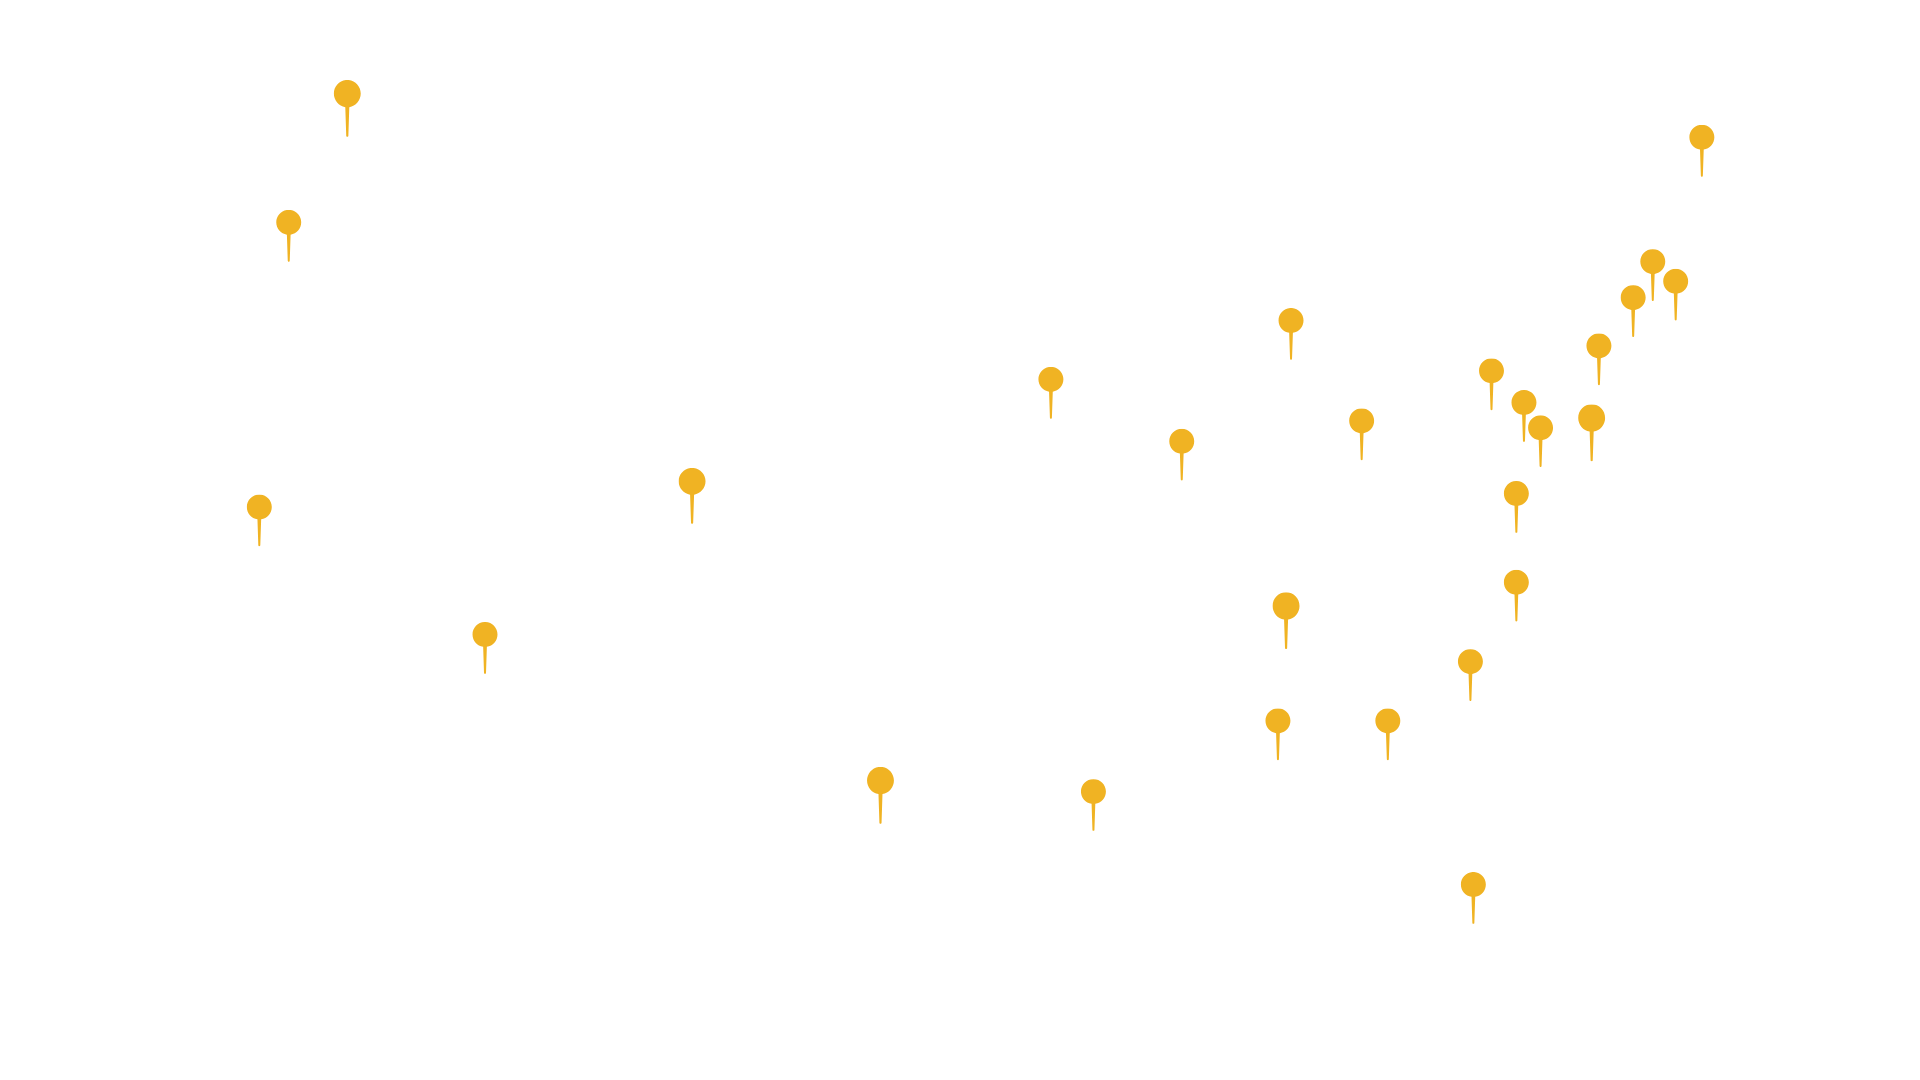
Student Representation
States represented in the admitted class include: California, Colorado, DC, Delaware, Florida, Georgia, Hawaii, Maine, Massachusetts, Maryland, Minnesota, Montana, New Hampshire, New Jersey, New York, North Carolina, Oregon, Pennsylvania, South Carolina, Tennessee, Texas, Utah, Virginia, Washington and West Virginia.
Countries represented in the admitted class include: Australia, China, Ghana, India, Korea, Pakistan, Saudia Arabia and Taiwan.
Multicultural Student Profile
-
17 %African American
-
7 %Asian
-
7 %Hispanic
-
1 %American Indian/Native Alaskan
-
5 %Multi-ethnic
-
2 %Not reported
Programs
Admitted students pursuing the following programs.
-
9 %Doctorate programs
-
63 %Master's programs
-
4 %Educational Specialist program
-
24 %Certificate programs
-
61 %Online & Hybrid programs